Innocenti Report Card 20: How economic inequality impacts child well-being
Living in a wealthy country does not guarantee that all children are equally happy, healthy and have the same level of academic and social skills. The latest edition of the UNICEF Innocenti Report Card series explores how economic inequalities impact children’s well-being.
The report considers this question in the context of 44 countries that are classified as high-income and/or are members of the Organisation for Economic Co-operation and Development (OECD).
Examining the relationship between child well-being and income inequality, the report asks:
- Even amidst wealth, why is it that some children fare better than others?
- How does inequality shape children’s well-being?
- How do children perceive inequality?
- What can be done to create equal opportunities for all children?
Overall child well-being in wealthy countries, including Aotearoa
Each edition of the Innocenti Report Card series ranks countries on how they are doing on key aspects of child well-being. The league table of Report Card 20 ranks 37 countries, where data are available, on three dimensions: mental health, physical health, and academic and social skills. The league table shows areas of strength and weakness across this group of countries.
Aotearoa’s position on the league table shows there is significant room to improve the wellbeing of tamariki and rangatahi here at home, with New Zealand ranking 32nd out of 37 countries overall.
Across the three indicators:
- New Zealand recorded the lowest level of mental well-being, ranking 37th out of 37 countries.
- New Zealand ranked 33rd out of 42 wealthy countries for physical wellbeing.
- New Zealand ranked 23rd out of 42 wealthy countries for skills.
Persistent poverty in a world of plenty
The wealthiest countries in the world continue to get richer. But despite this increasing prosperity, large inequalities persist within these countries. Even in the most equal countries, people in the top 1/5 of the income distribution have 3.5x as much income as people in the bottom 1/5. In the most unequal countries people in top 1/5 have income more than 7x than people in the bottom 1/5.
Why does this matter for children?
The report shows that a wider gap between the rich and the poor in a country is linked, on average, to poorer physical health, mental well-being and skills for children.
Additionally, child poverty statistics show – a sign of inequality at the lower range of incomes – remains stubbornly high. It affects at least 1 in 10 children in every country studied.
How economic inequality shapes children’s lives
Economic inequality has a clear relationship with how healthy children are, how happy they are and the academic and social skills that they develop.
Physical Health: Income inequality
and rising childhood obesity statistics
Children (between ages 5–14) are more likely to die in childhood if they live in unequal societies, and they are more likely to be overweight. While these mortality rates have fallen substantially in general, there are signs that they are increasing in some countries. The five countries with the highest levels of economic inequality have child mortality rates, on average, 2.4x those in the 5 most equal countries.
Children in unequal societies are at a higher risk of overweight and obesity. A child’s food and nutrition are influenced by the quality of foods their family can buy and prepare.
Lower income families find it difficult to afford healthier food options and rely on energy-dense foods putting the children at risk of overweight and obesity. The share of children who are overweight is 1.7x higher in the most unequal countries than in the most equal countries.
Mental well-being: Living standards
and adolescent life satisfaction
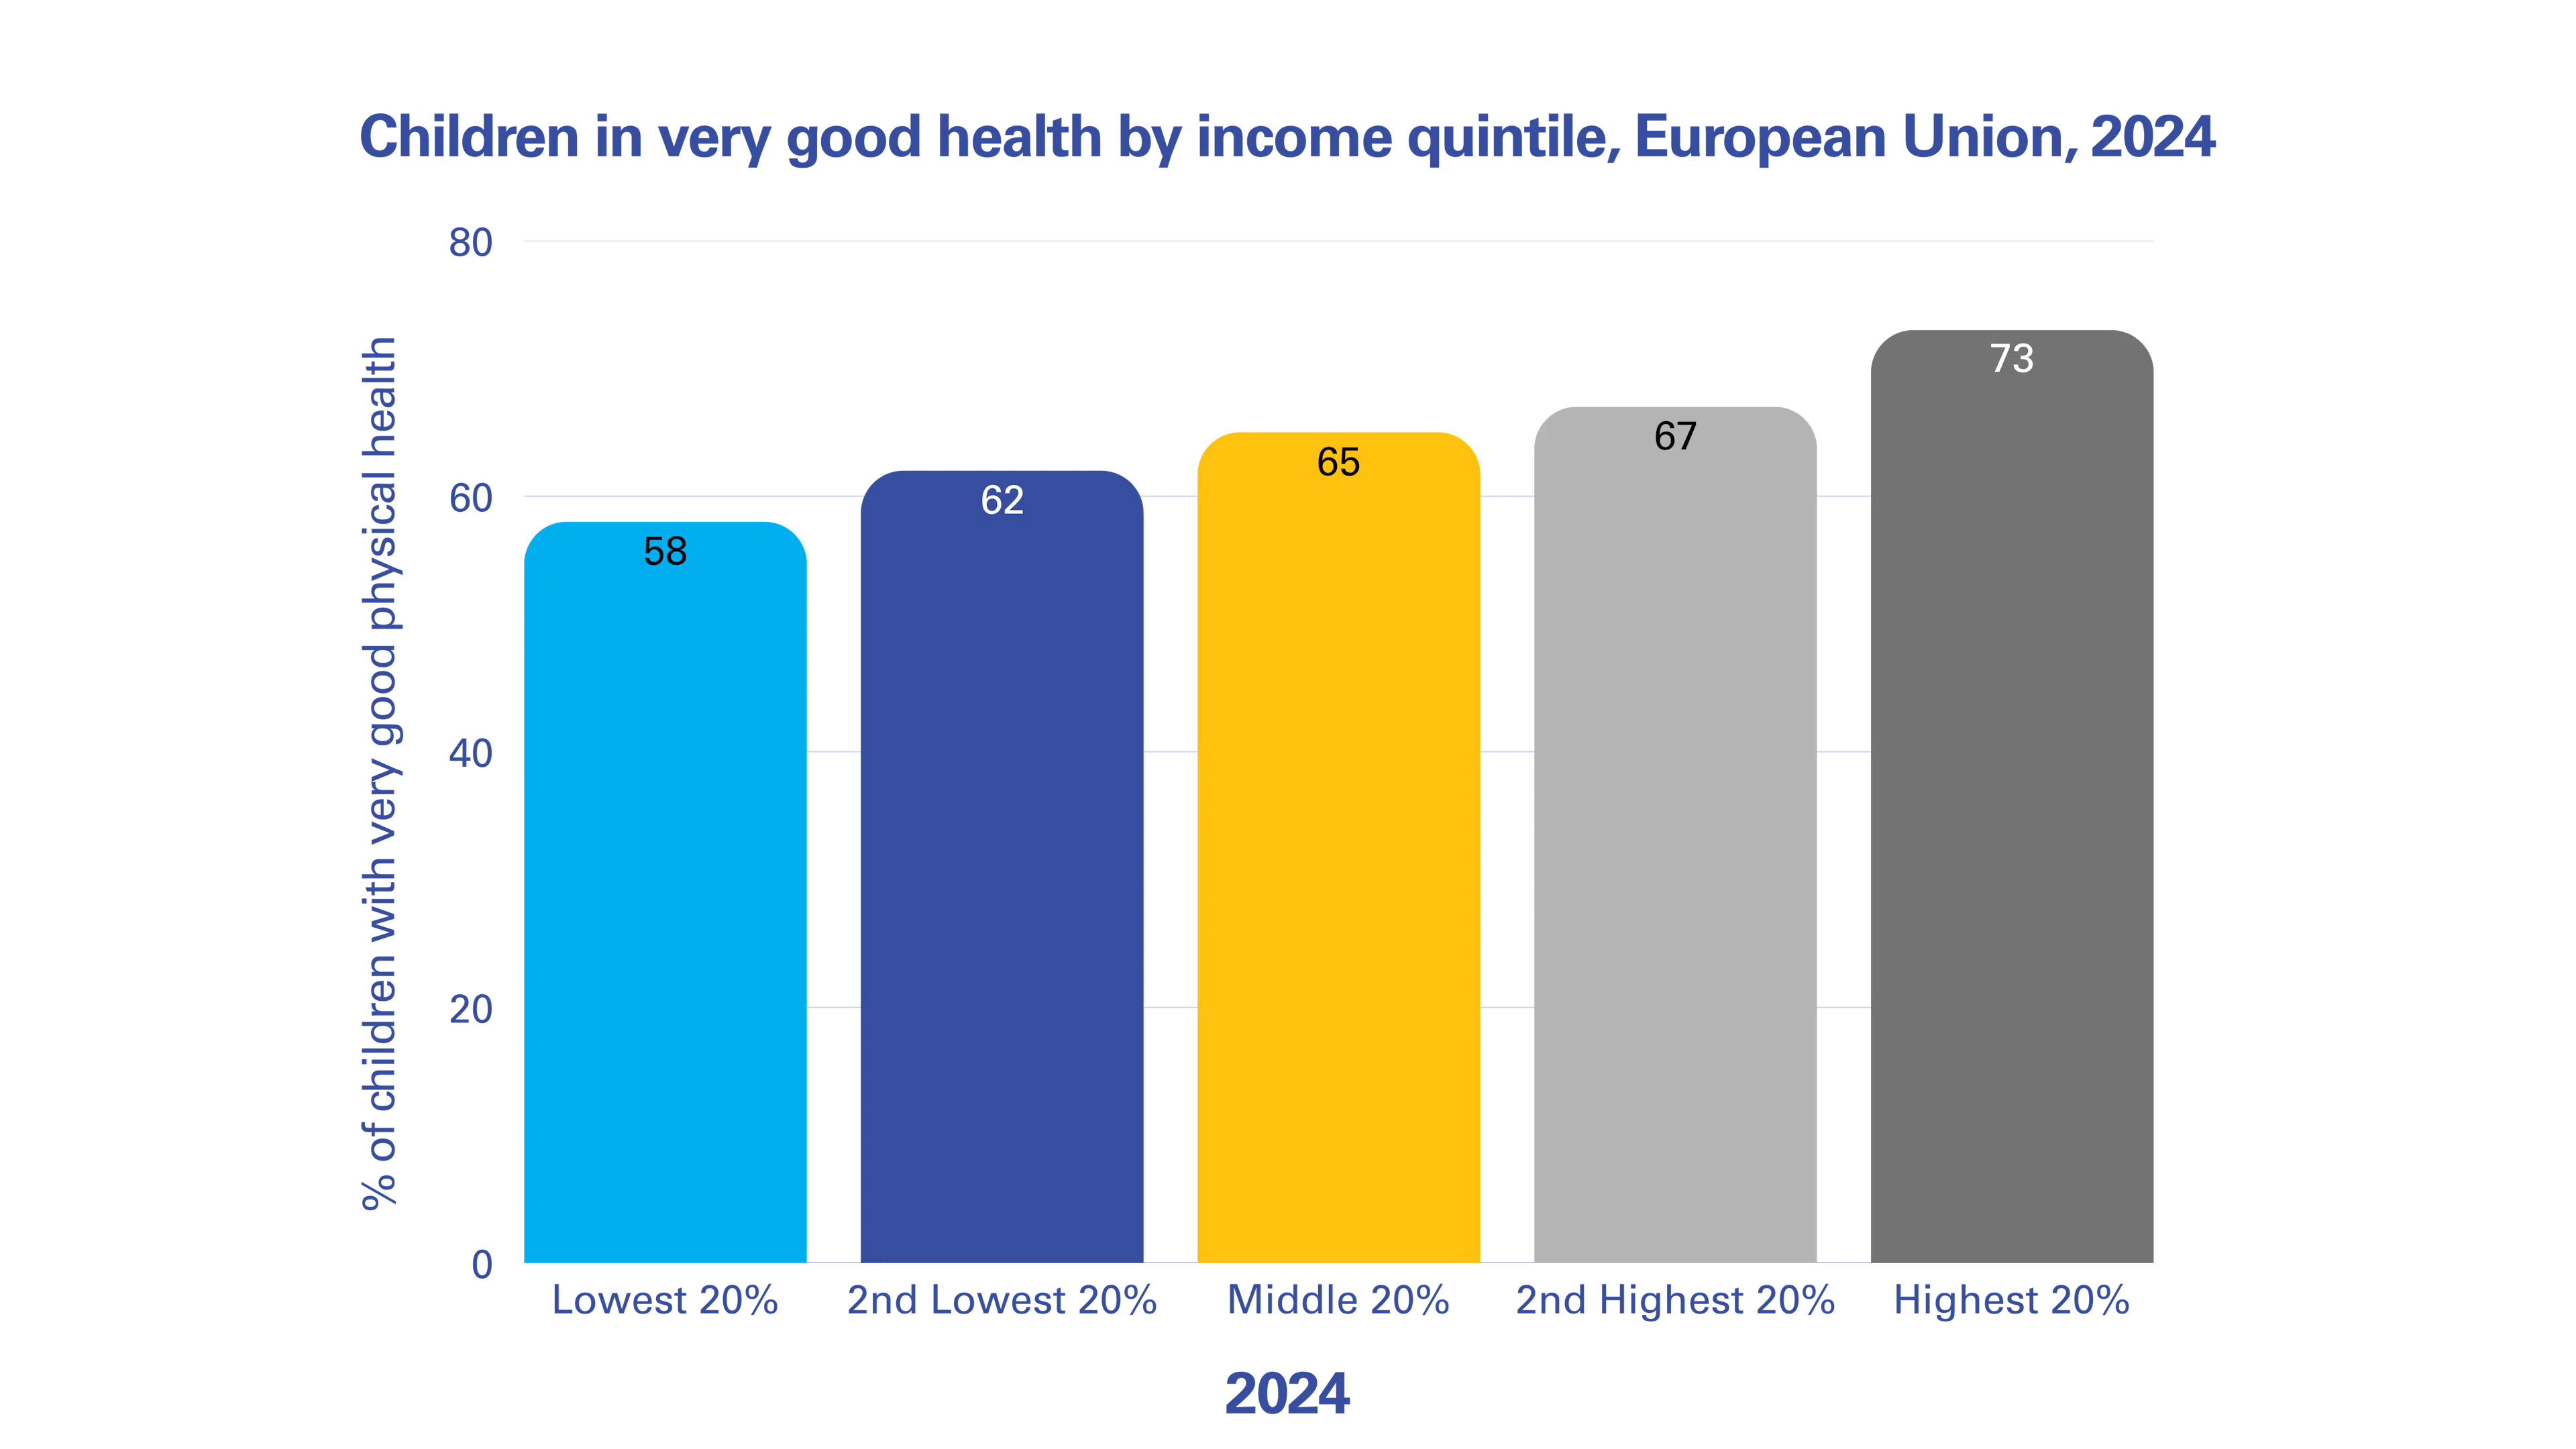
Economic inequalities are also linked to inequalities in mental well-being. Around 77% of children living in the most advantaged families report high life satisfaction compared to only 67% in the most disadvantaged families.
Children’s skills: Addressing
educational inequality
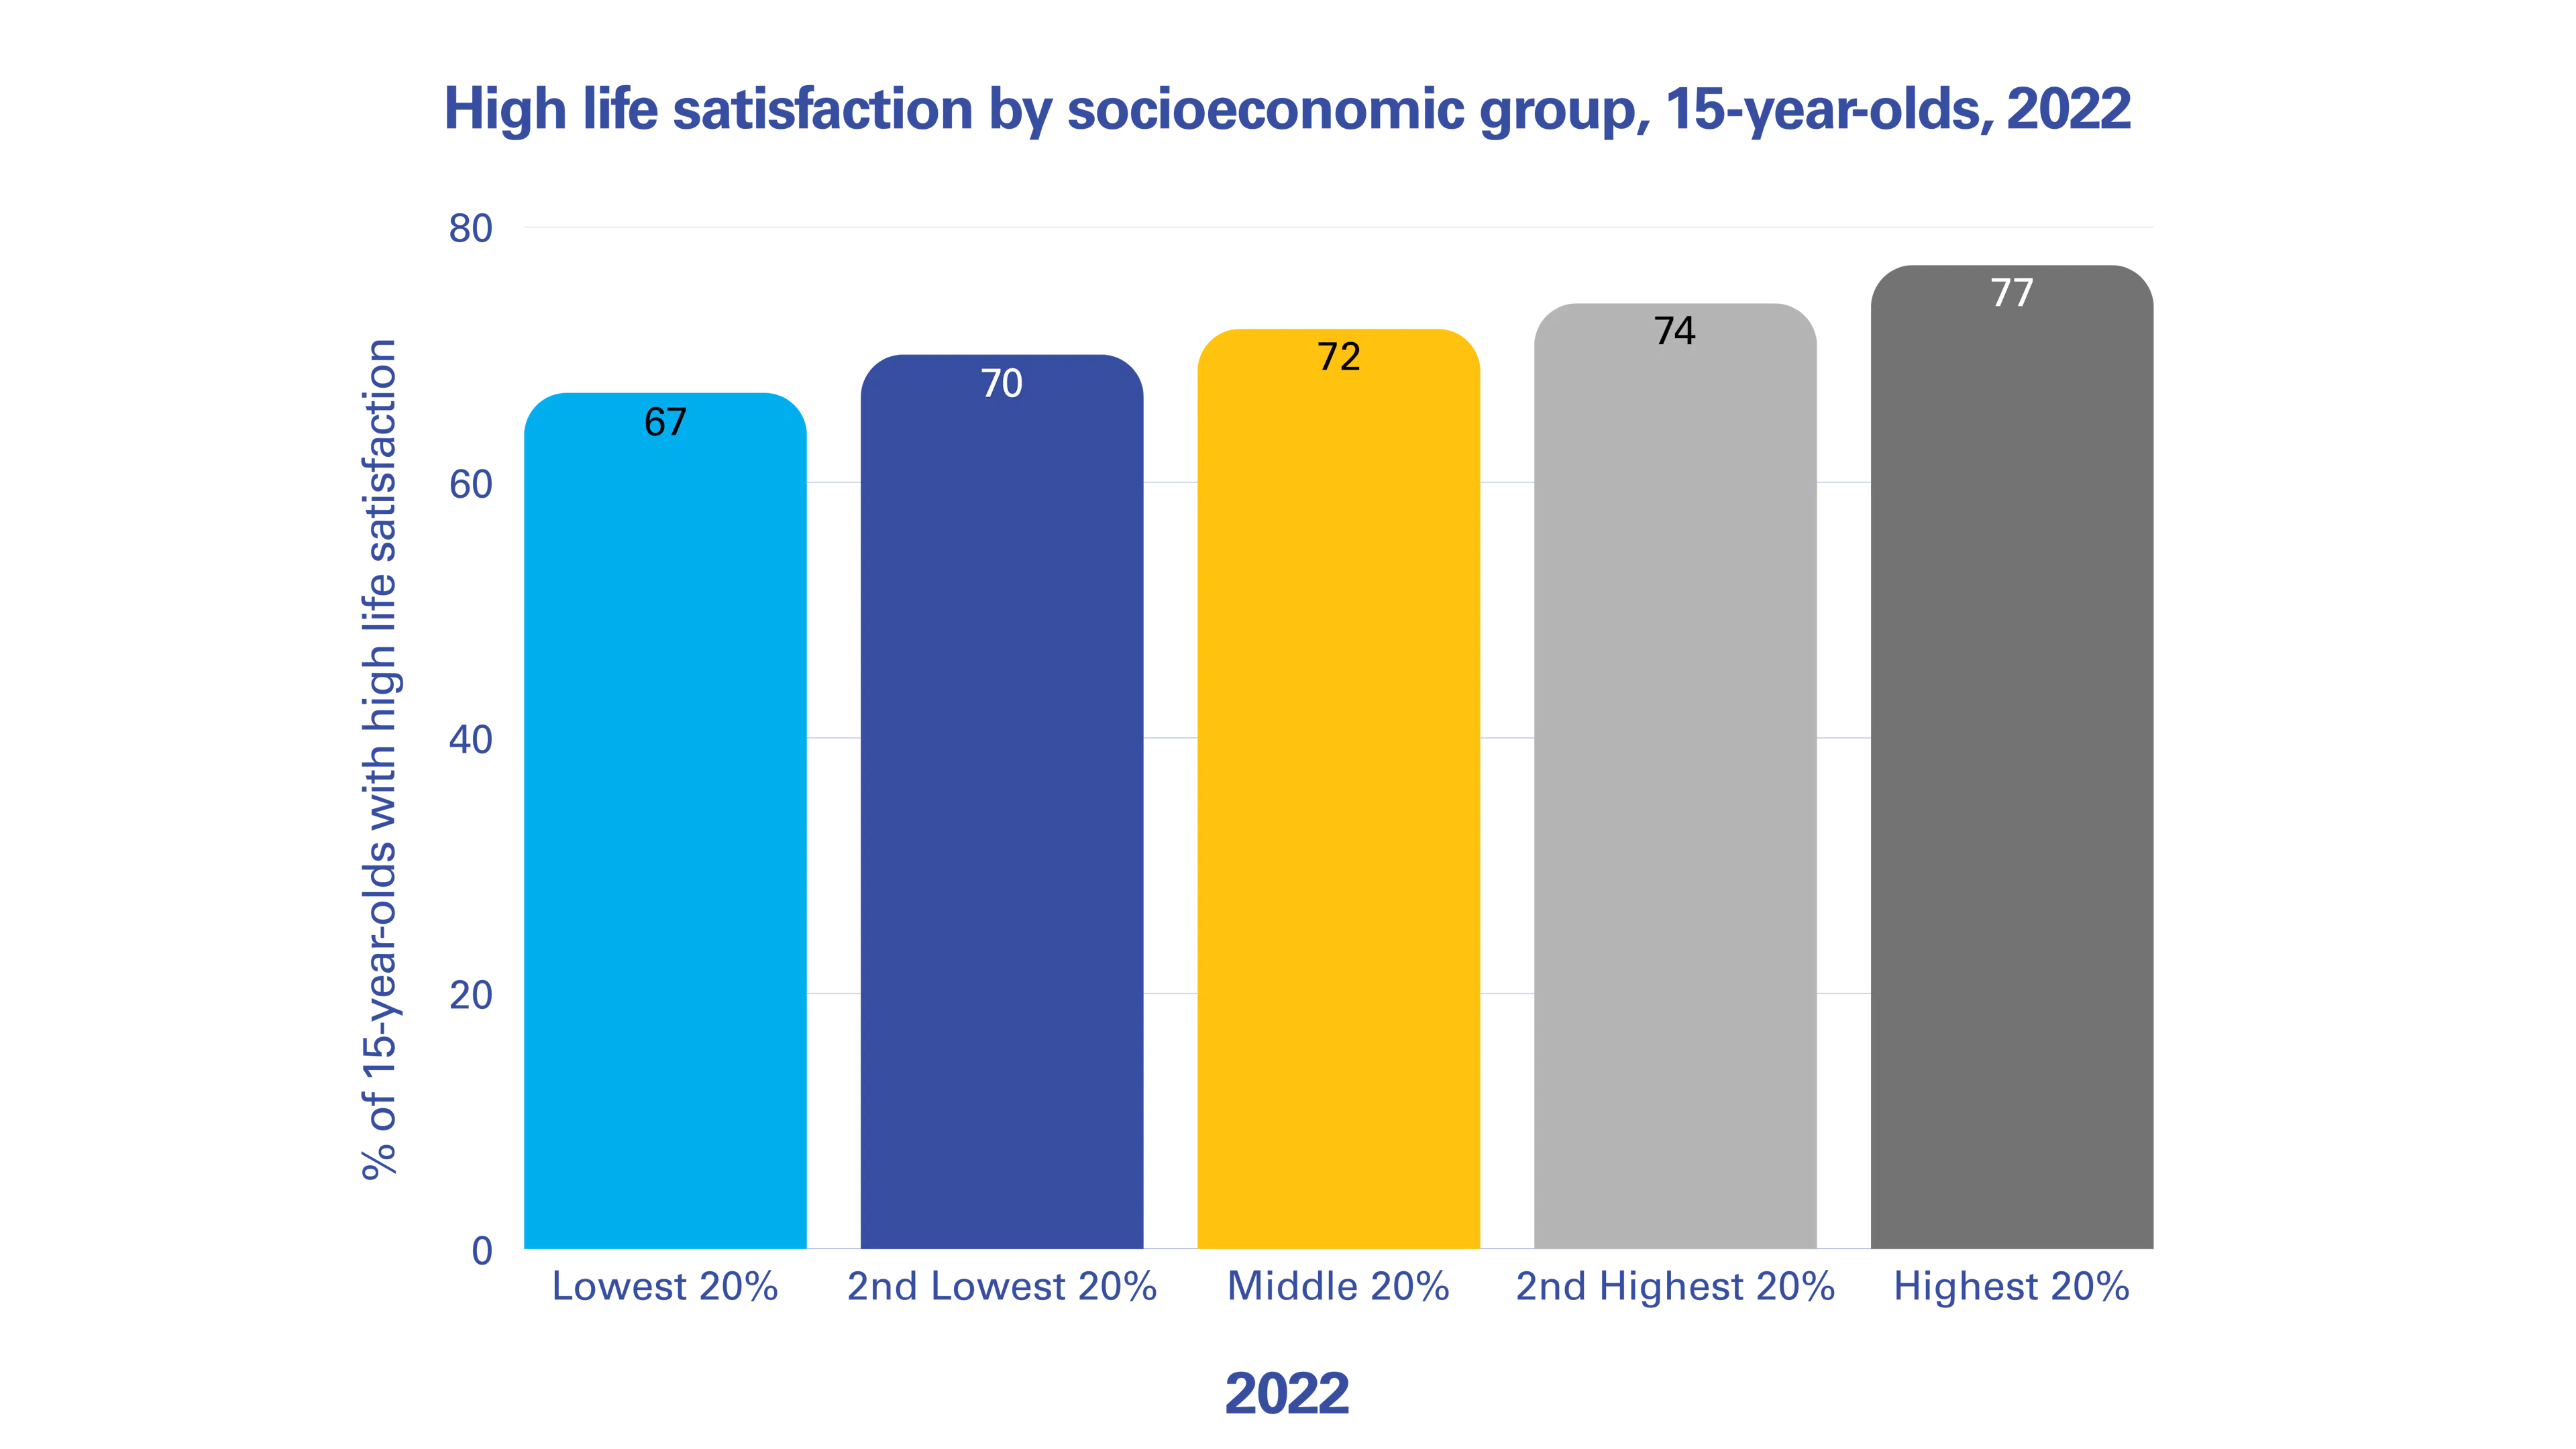
Income inequality also holds back children’s academic performance and social skills. There are notable gaps in academic achievements among 15-year-olds living in this group of countries. On average, children in wealthier families are almost twice as likely (83%) to have basic academic proficiency in reading and mathematics by age 15 than children in poorer families (42%).
What can countries do to minimise
the harm done by inequalities?
Beyond material resources, economic inequalities can affect child well-being through other pathways. Economically disadvantaged children, and their families, often face greater levels of stress, stigmatisation, and discrimination in various aspects of their lives. Governments and stakeholders can act in several policy areas to minimise the impact of inequality on children’s well-being, particularly by reducing child poverty.
Actions can include:
Highlights
The latest UNICEF Innocenti Report Card 20 Unequal Chances: Children and economic inequality examines how economic inequality shapes children’s lives across 44 countries that are classified as high-income and/or are members of the Organisation for Economic Co-operation and Development (OECD).
The wealthiest countries in the world continue to get richer, yet large inequalities persist within these countries – and these gaps have serious consequences for children’s physical health, mental well‑being and skills.
The report updates UNICEF Innocenti’s league table of child well‑being and shows that countries with lower levels of income inequality and child poverty tend to achieve better outcomes for children overall. At the same time, stark inequalities within countries mean that children from poorer families consistently face higher risks of ill health, lower life satisfaction and weaker educational outcomes.

The report concludes with clear policy directions, calling on governments to reduce child poverty, promote fair access to resources and services, and work with children themselves to create more equitable societies because reducing inequality is essential to ensuring that every child has a fair chance to thrive.
How the Report Card
comparisons are reached
The report card looks at 6 indicators of child wellbeing across three dimensions: physical wellbeing, mental wellbeing, and skills, and then ranks countries on how well they are doing for children. To do this, it draws on comparable data from 44 countries in the Organisation for Economic Co-operation and Development (OECD) and the European Union (EU).
Two key datasets tell us about Aotearoa’s physical wellbeing ranking (33 out of 42) in Report Card 20. These are:
- Child mortality (ages 5–14): This measures the chance that a child who has reached age 5 will die before age 15. It is shown per 1,000 children aged 5. This data comes from the United Nations Inter-agency Group for Child Mortality Estimation, and the most recent relevant data source is from 2023.
- Overweight prevalence (ages 5–19): This measures the share of children and teenagers whose body mass index is more than one standard deviation above the World Health Organization growth reference median. The result is based on the average for boys and girls. This data comes from the Non-Communicable Disease Risk Factor Collaboration (NCD-RisC).
Two key datasets tell us about Aotearoa’s mental wellbeing ranking (37 out of 37) in Report Card 20. These are:
- High life satisfaction (age 15): This measures the share of 15-year-olds who rate their life satisfaction above 5 on a scale from 0–10. This data comes from the Programme for International Student Assessment (PISA), and the most recent comparable data available is from 2022.
- Suicide rate (ages 15–19): This measures the number of suicides per 100,000 young people aged 15–19, using the most recent data available. In the case of Aotearoa, the suicide rate for 15-19-year-olds is calculated as a three-year average from 2019 to 2021, using confirmed data from Health New Zealand (Te Whatu Ora) and the Chief Coroner.
Two key datasets tell us about Aotearoa’s skills ranking (23 out of 42) in Report Card 20. These are:
- Academic proficiency (age 15): This measures the percentage of 15-year-olds who reach what PISA has agreed is the most basic level of skills needed to take part fully in society right now, which it refers to as PISA Level 2. This data comes from PISA, and the most recent comparable data available is from 2022.
- Social skills (age 15): This measures the share of 15-year-old students who say they agree or strongly agree that they make friends easily at school. This data comes from PISA, and the most recent comparable data available is from 2022.